 |
|||
|
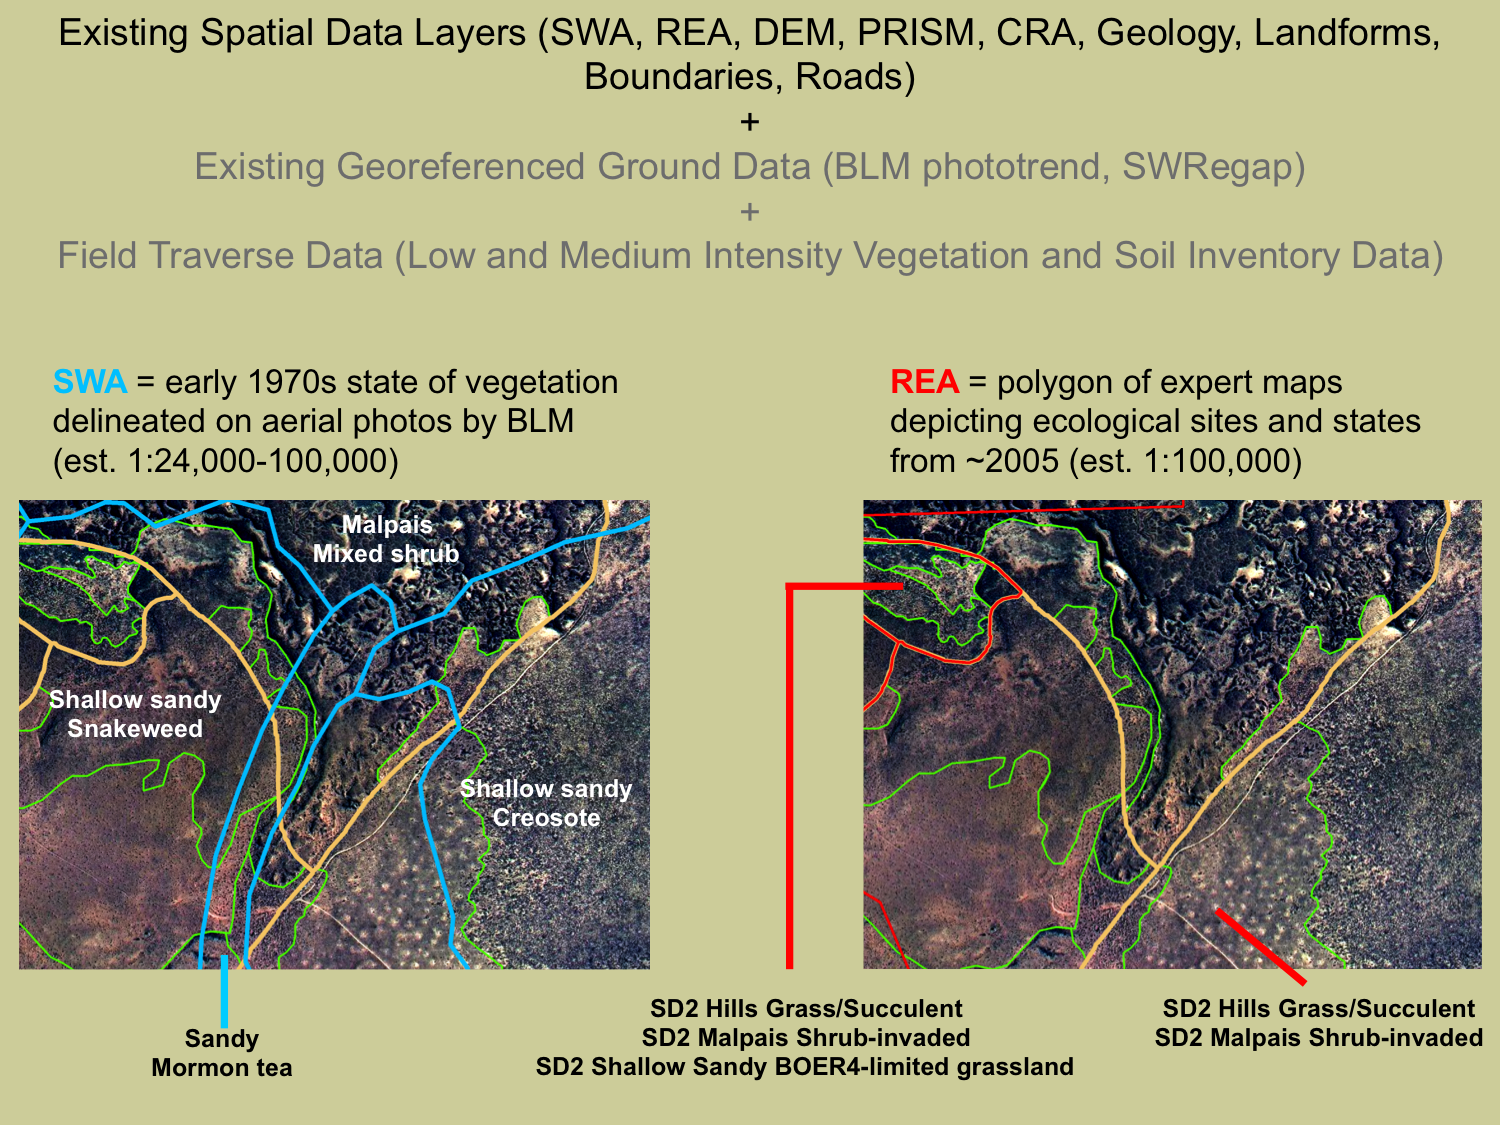
Where available, existing spatial data can assist with determining and attributing the ecological site or state for a given polygon. At a minimum, a digital elevation model (DEM), MRLA, LRU (CRA), land ownership and road spatial data layers should be available for any area within the United States. The DEM is valuable for confirming the elevation, and thus that an area in question falls within a specific LRU. A spatial data layer for annual rainfall (e.g., PRISM = Parameter-elevation Regressions on Independent Slopes Model; PRISM Climatic Group, 2010) can also be helpful in ascertaining the LRU. Management boundaries are useful for distinguishing soil versus vegetation differences. Expert maps of vegetation, ecological sites or ecological states may already exist. These are most valuable for (a) unfamiliar and remote areas that are difficult or impossible to visit for field traverses and (b) confirming areas the technician believes to be a specific ecological site or state. Downfalls of expert maps are predominantly related to the scale of the mapping effort (usually near 1:100,000); coarse scales lead to generalizations and corresponding incorrectly labeled ecological sites or states. Geology and landform spatial data layers can be useful in determining ecological sites, especially where the sites are linked to parent materials derived from specific types of bedrock. |
|||
 |
|||
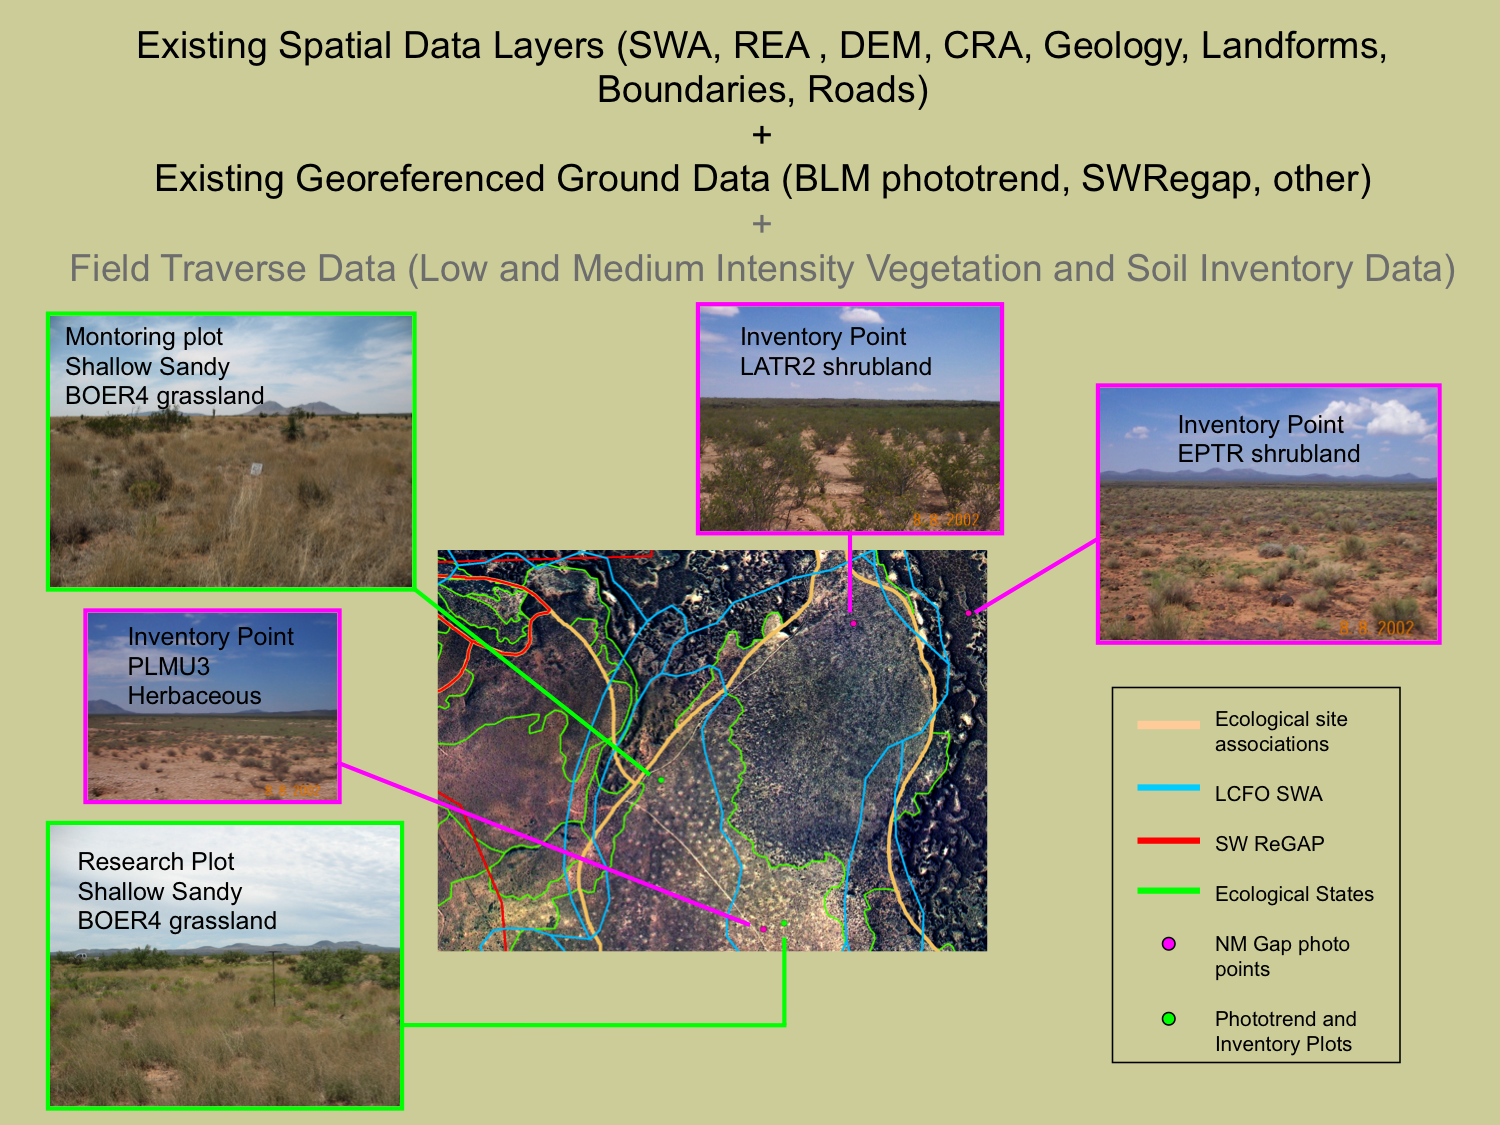
| Any type of data that consists of a georeferenced point on the ground (UTM coordinates with a known coordinate system and zone) are valuable. Data may just contain coordinates and a photo. Sometimes these are accompanied by a plant community name. Also valuable are coordinates and a list of dominant species (with estimates of plant cover). The most valuable georeferenced ground data include: UTM coordinates, photo(s), soil profile characteristics, and detailed vegetation data (e.g., line-point intercept data providing canopy cover by species). Such data allow the technician to determine ecological site and state without local field work. | |||
 |
|||
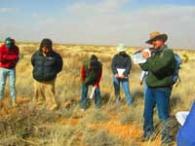
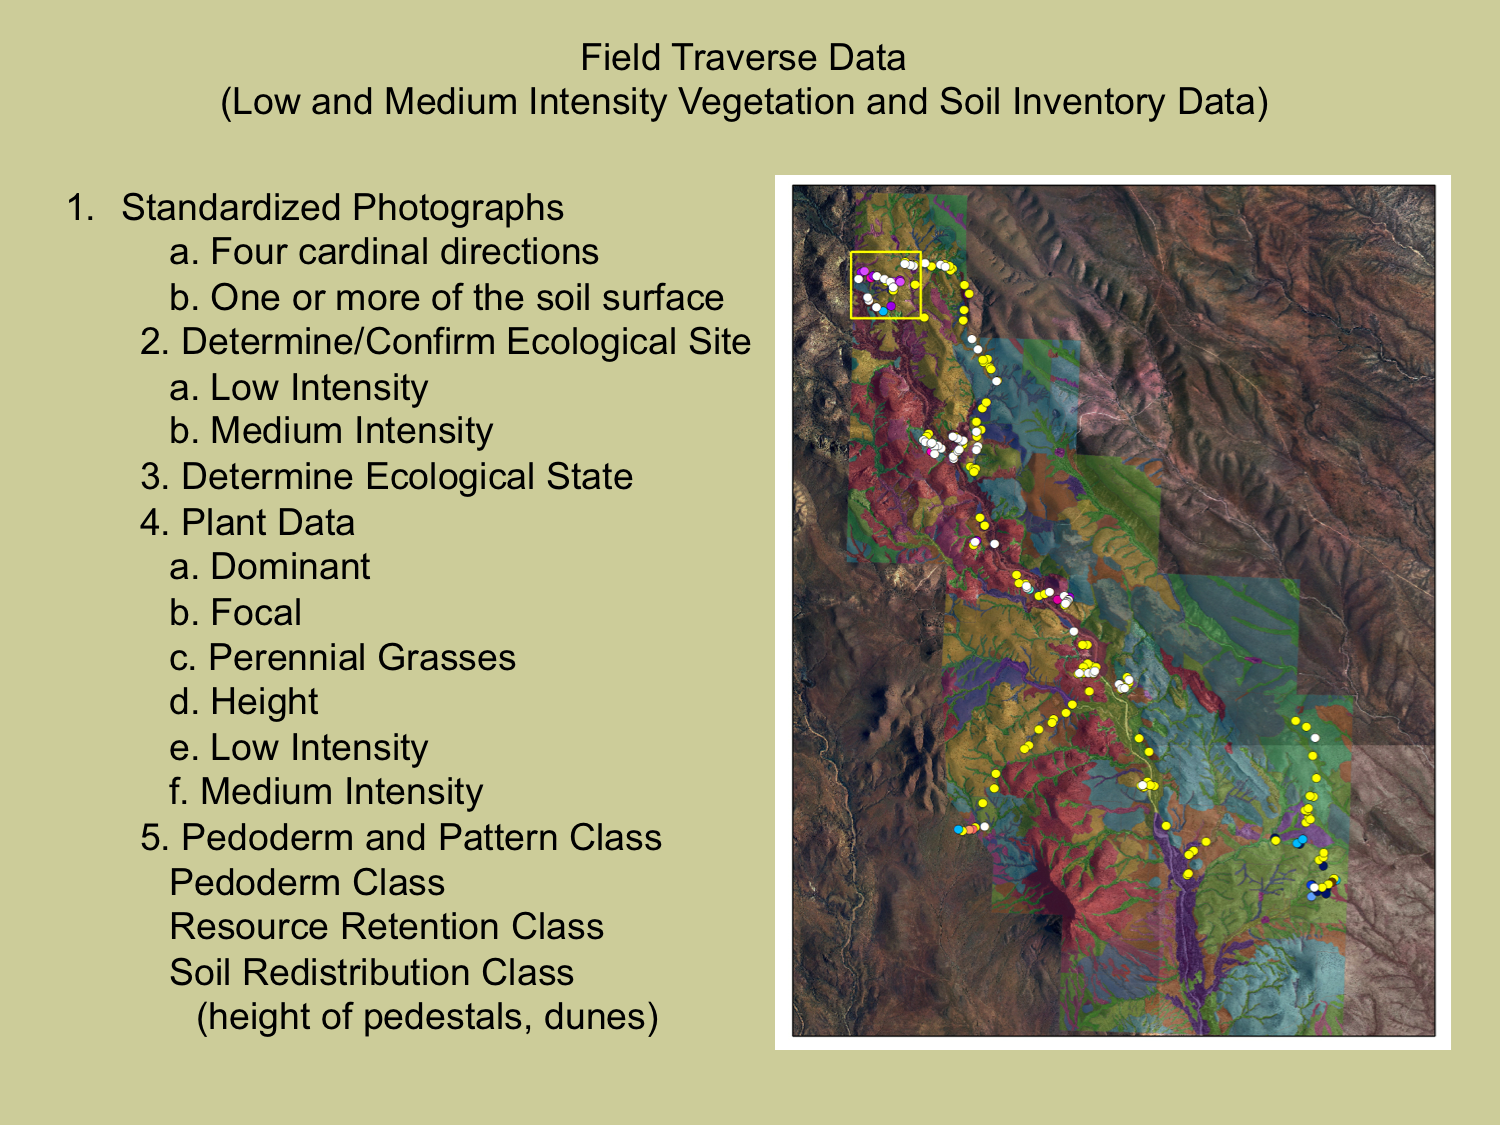
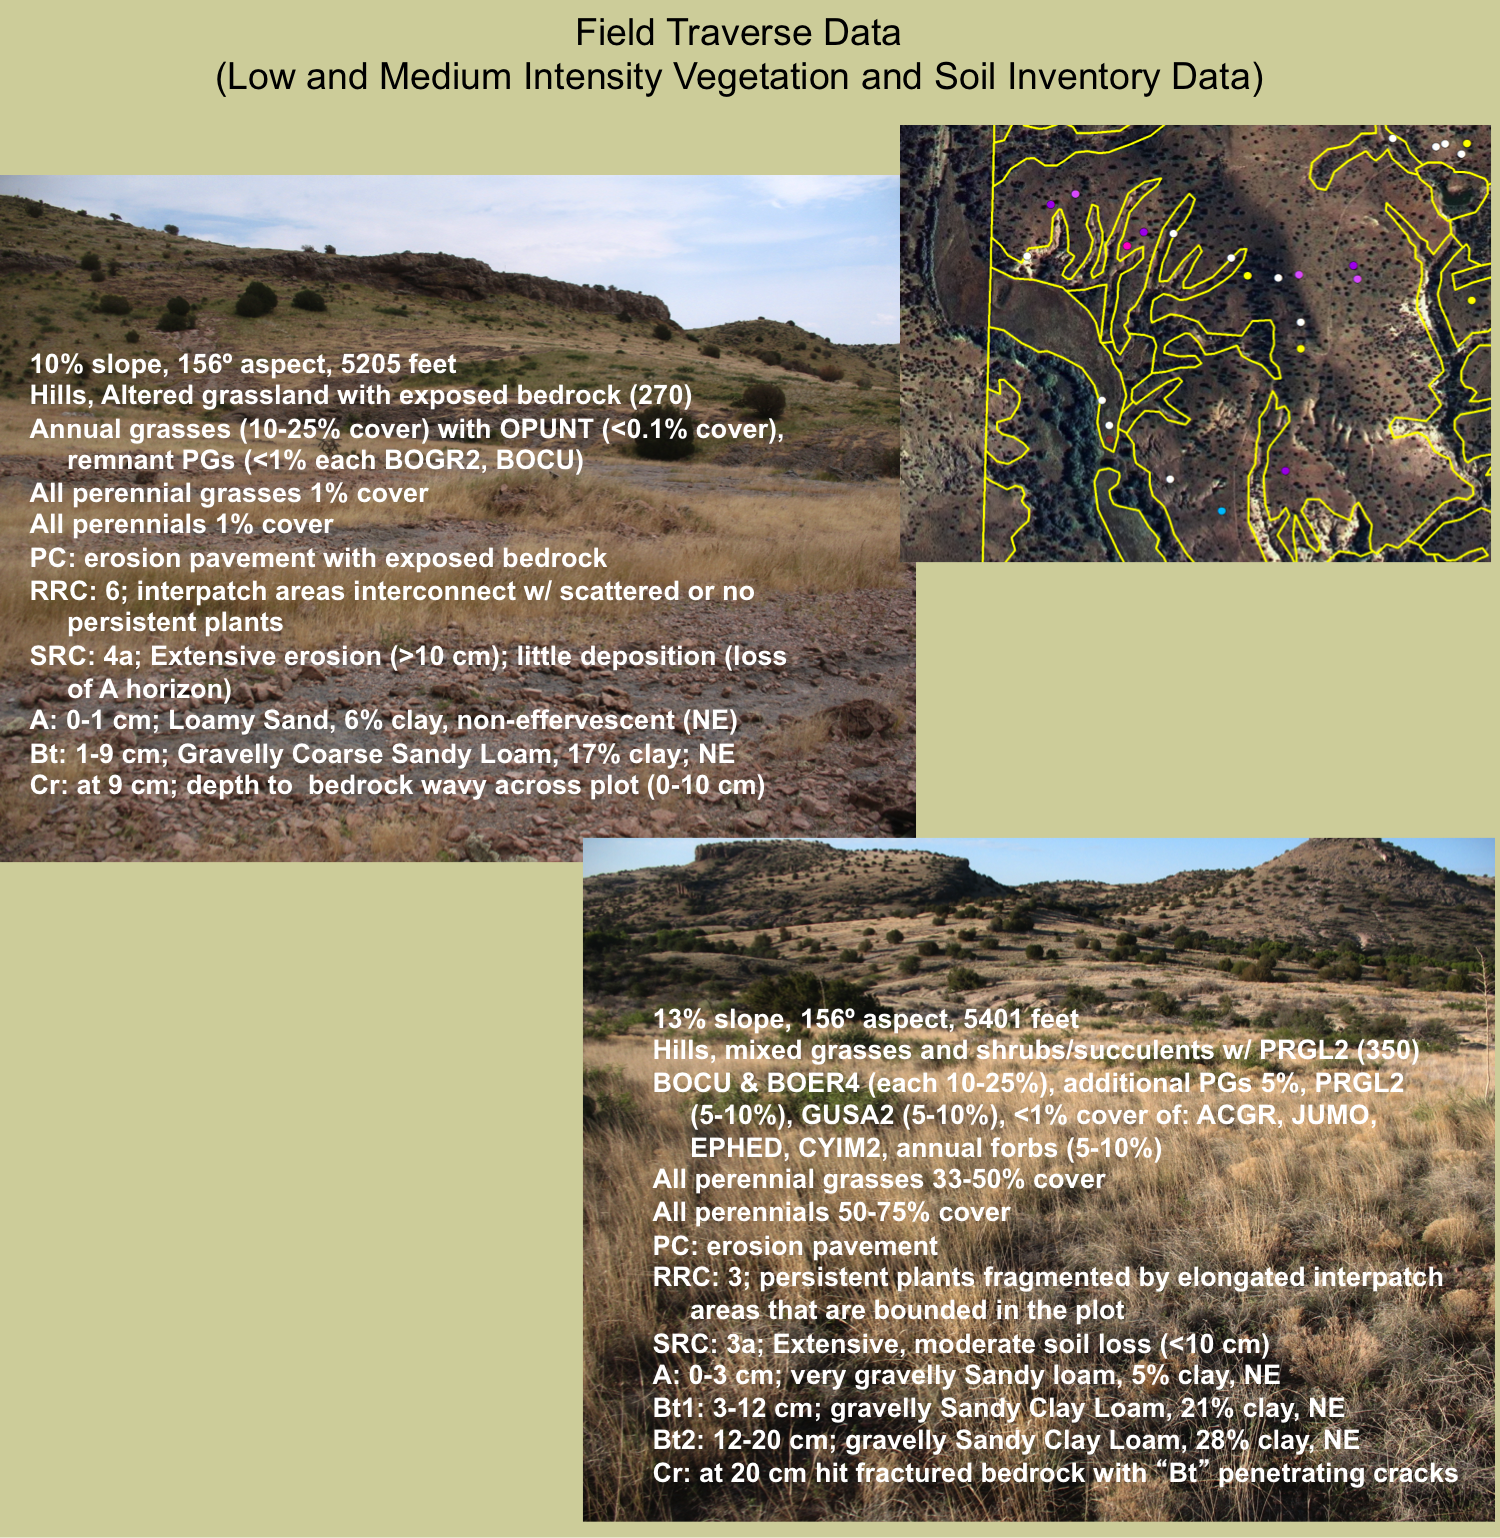
| Often, georeferenced ground data do not exist. In that case, traverse data must be collected to verify states/ecological sites. Traverse data can be collected at low or medium intensity. In the image provided here, white points are low intensity traverse points, colored points are medium intensity. Each low-intensity traverse point includes UTM coordinates, photos, an evaluation of Pedoderm and Pattern Classes, a list of the dominant 3 or 4 perennial plant species, and a designation of the ecological site and state. If a non-dominant, focal species is present it is also recorded (e.g., in MRLA 42 black grama is an important key species, honey mesquite and Lehmann lovegrass are important invasive species). Medium intensity soil data includes a description of the key soil horizons at a site (A, B1, and diagnostic horizons). Medium intensity vegetation data include canopy cover classes for each perennial plant species, average plant height for dominant species, and percent of perennial grass cover growing within woody species (a measure related to the STM). A cover class is also assigned for the plot for all perennial grasses combined. | |||
 |
|||
|
In the yellow box we can see white, low intensity traverse points, and multi-colored medium intensity points overlain on a DOQQ. Within the multi-colored medium intensity points, those of the same color represent the same ecological site and state. The two ground photos show two different traverse points. These traverse points have similar slopes, aspects and elevations. The field soil profile descriptions placed both points in the “Hills” ecological site, although the point in the upper left has lost almost all of its surface soil (A horizon). The point represented by the photo in the upper left would be considered in an altered grassland state with eroded areas to exposed bedrock. The point depicted in the lower right represents a mixed grass-shrub/succulent state with some shrub-dominated patches scattered throughout the landscape. Take time to contrast the percent of perennial grass cover between these two points, as well as the Pedoderm and Pattern Classes. Traverse data are important data elements needed to attribute state polygons, but they also serve as data products that can be used down the road for management planning, monitoring and assessment extrapolation, etc. |
|||
|
|
 |
||
Quick links:
|
|||