| NRCS SSURGO detailed soil map | |||
 |
|||
|
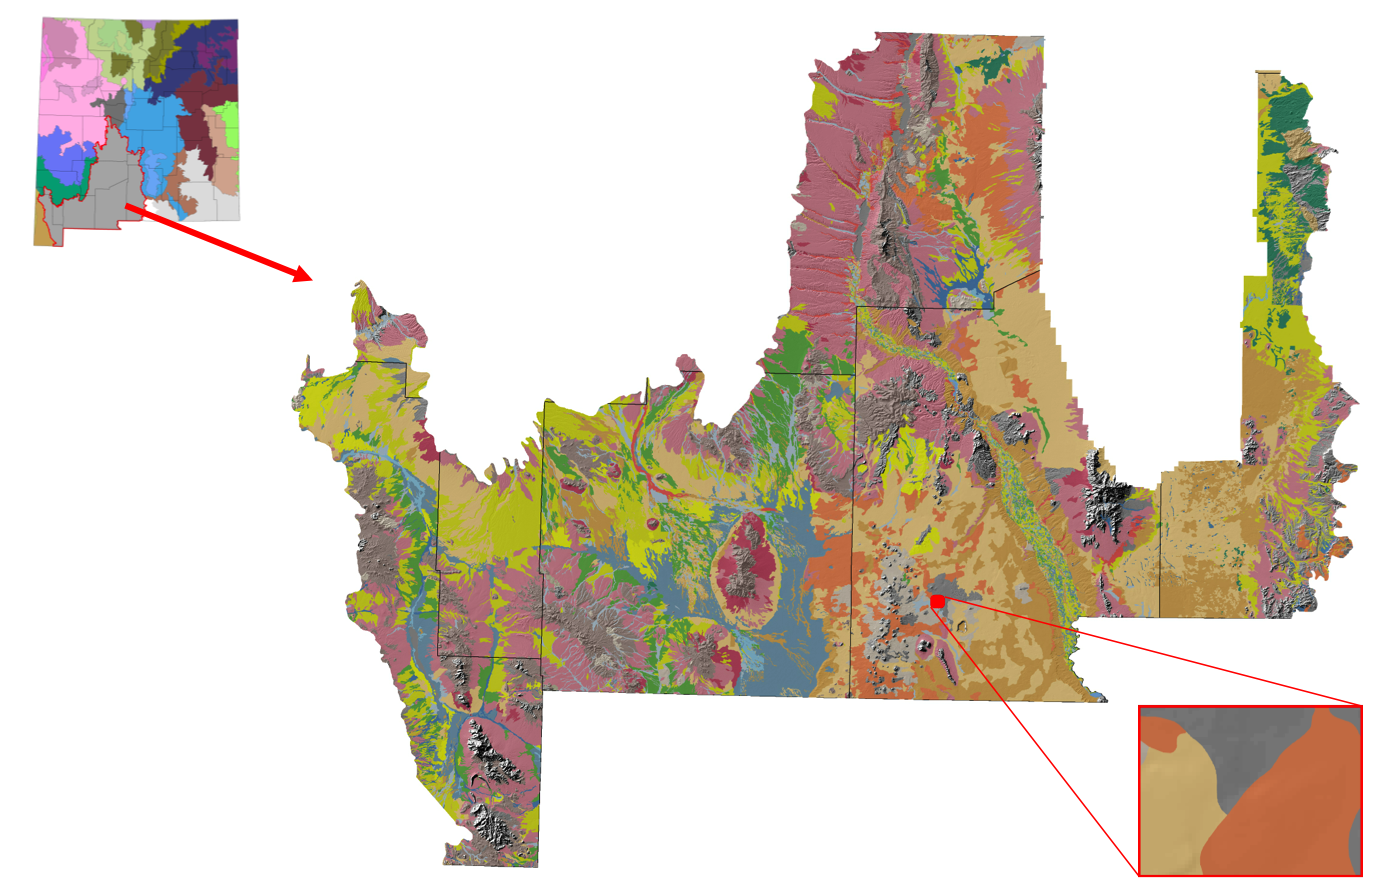
SSURGO soil maps within a given LRU or MRLA can be used to map ecological sites, which often occur in predictable patterns across the landscape. Illustrated here are the soil map units within MLRA 42 in New Mexico. It is important to note that the accuracy of any given soil survey is related to (1) the scale at which the soil survey was conducted and (2) the age of the soil survey. Courser-scaled soil maps (1:24,000, 1:100,000) are less able to resolve individual soil components. Older soil surveys often did not have modern soil classifications and mapping procedures. In the lower right we have pulled out a small area within MRLA 42 to facilitate a discussion of soil map units and soil components. |
|||
| NRCS SSURGO soil survey polygons & SMU components | |||
 |
|||
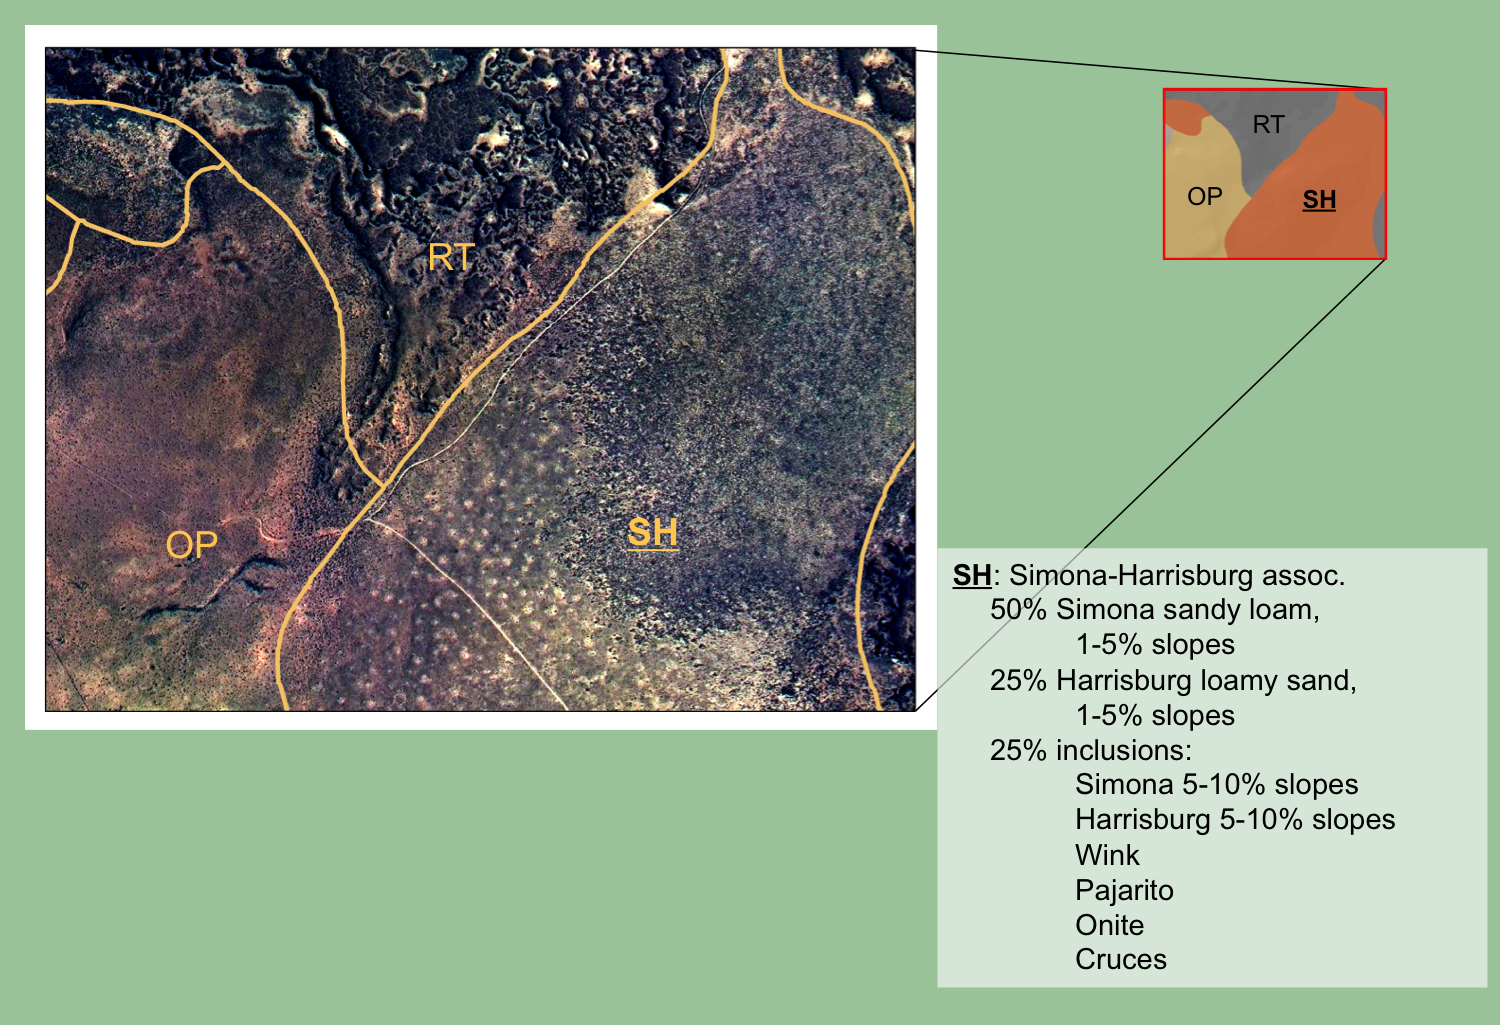
| Our focal area contains three soil map units. SSURGO polygons are identified by a soil map unit symbol. Each soil map unit symbol has its own unique name and represents one, or more than one, soil component (or soil series phase). It is helpful to think of a soil series as a “species,” and soil components as subspecies. The soil map unit symbols depicted here are RT (Rock outcrop-Torriorthents association), OP (Onite-Pajarito association) and SH (Simona-Harrisburg association). Focusing on SH, we can see that two major soil components comprise this soil map unit. Thus, 50% of the SH soil map unit is the Simona sandy loam, 1-5% soil component. The next major component of the SH soil map unit is the Harrisburg loamy sand, 1-5% component (25%). The remaining 25% of the soil map unit is comprised of six other types of soil (2 components and 4 series). | |||
 |
|||
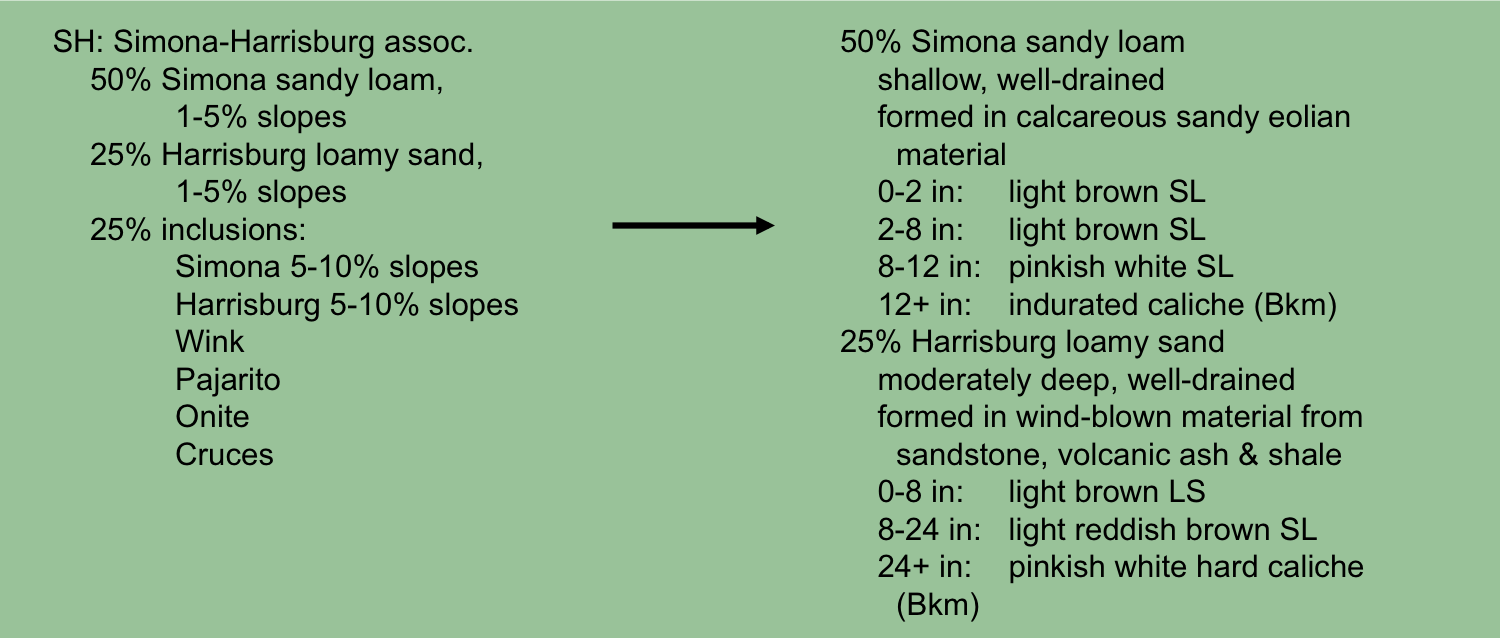
| Mappers should review the properties of soil components in the mapping area. We can see here that the Simona sandy loam, 1-5%, soil phase is characterized by light brown sandy loam soils in the upper 8 inches. Then, from 8-12 inches soil color changes to pinkish white and finally a petrocalcic horizon is reached at 12 inches. In contrast, the top 8 inches of Harrisburg loamy sand, 1-5%, soil phase is coarser textured (loamy sand). This is followed by a texture and color change (light reddish brown sandy loam). Texture from 8-12 inches is similar for the two soil components, however, the petrocalcic horizon is considerably deeper in the Harrisburg loamy sand (24 inches). Understanding soil surface and subsurface color, as well as texture, assists with interpretation of imagery and verifying the ecological site. Color differences within imagery can be due to different soils, erosion of the same soil, and different plants. | |||
|
|
 |
||
Quick links:
|
|||